Sidecar is a B2B digital marketing solution for retailers. Sidecar provides its customers with a blend of technology and retail experts to manage campaigns across multiple e-commerce networks. These networks include Google Shopping, Google Paid Search, Bing Shopping, Bing Paid Search, Amazon Ads, and Facebook Ads.
What is Sidecar Connect?
Sidecar Connect is an interface built for both Sidecar employees and Sidecar customers. For Sidecar employees, Connect is a centralized place to manage technology for customer accounts. For Sidecar customers, Connect is a reporting dashboard to view marketing channel performance.
Process
The problem
Rebuilding an existing tool for stability, scalability, and a better user experience.
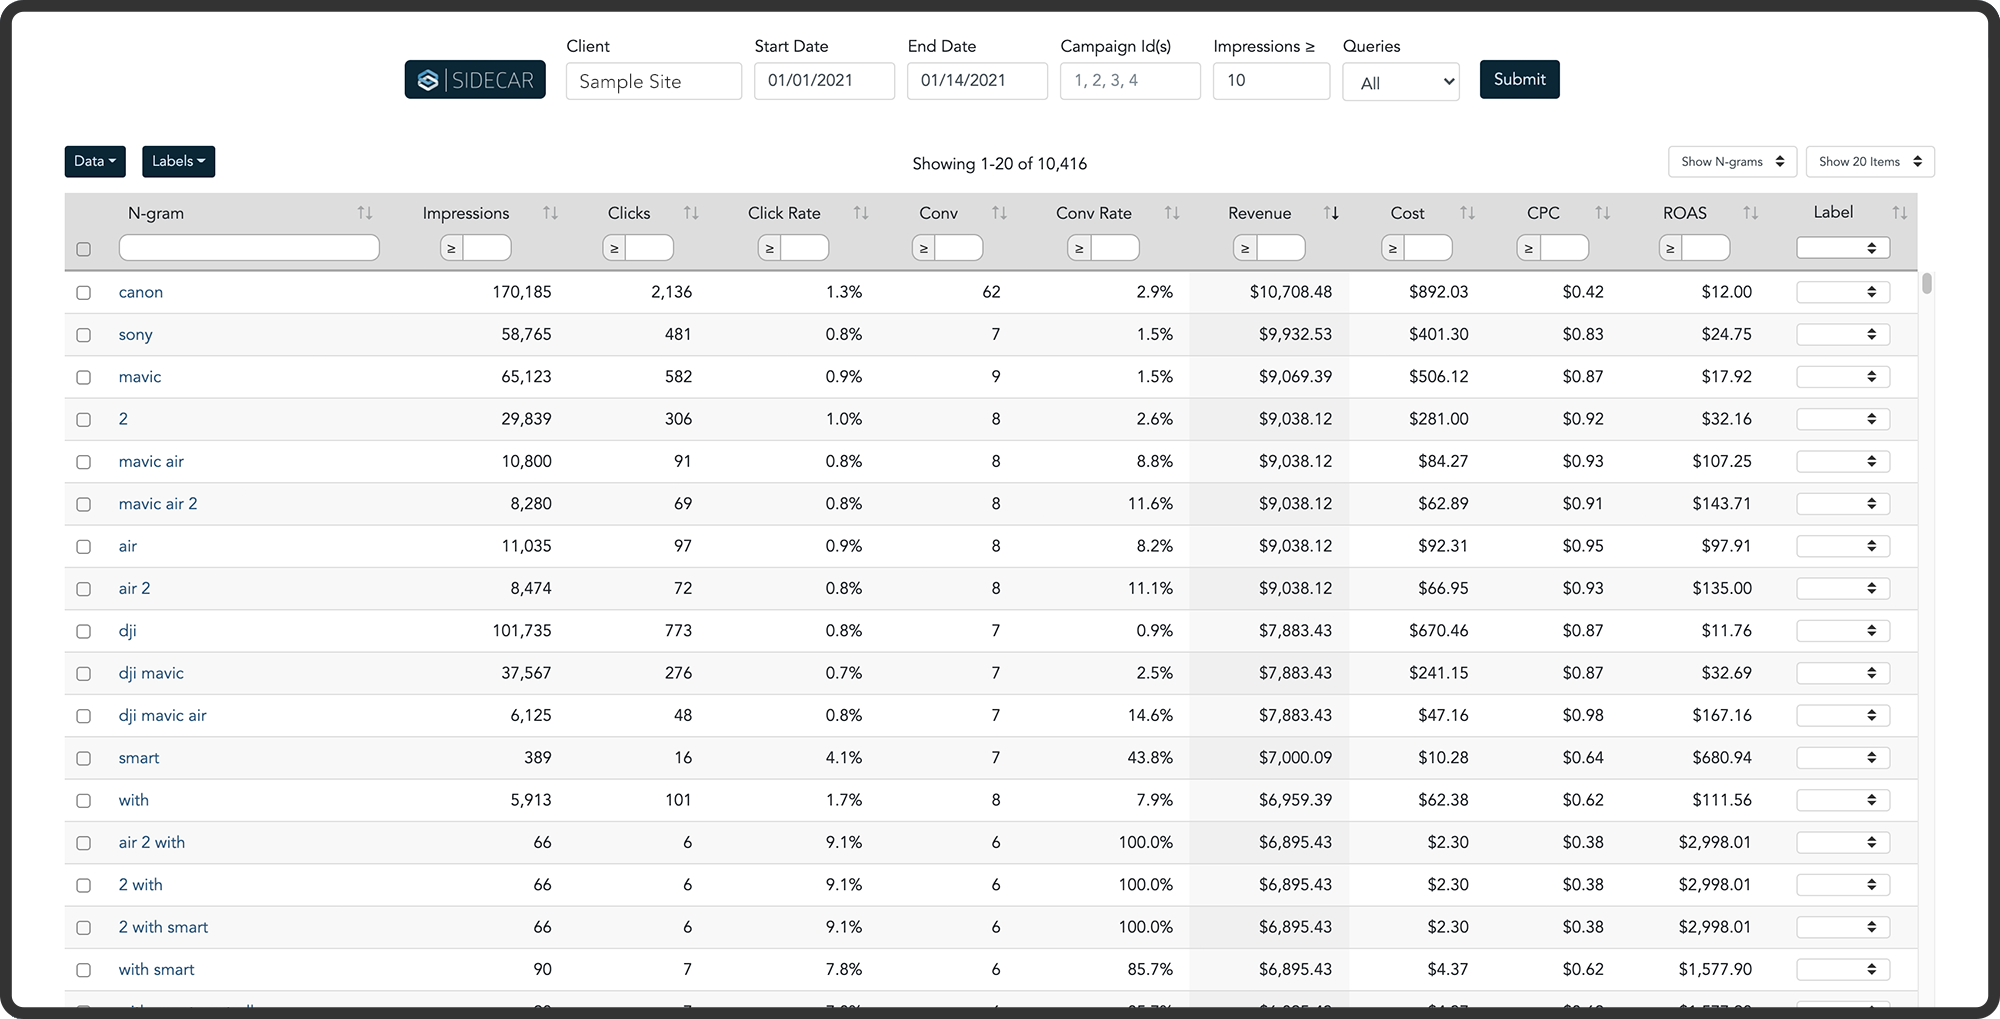
One of Sidecar’s core tools for managing Google Shopping and Google Paid Search clients is known as the Search Query Management (SQM) tool. This feature allows Sidecar analysts to perform an in-depth analysis of search query and n-gram performance for a client’s website.
SQM was originally built before our technology management platform, Sidecar Connect, and was therefore created as a standalone tool. In order to continue to support this tool with better backend stability and new features, the product and engineering teams made the decision to rebuild the feature from the ground up within Connect. This created an opportunity for product and I to re-evaluate the features and overall experience of the tool.
The Research
Understanding usage and identifying areas of opportunity.
The first step to re-building SQM began with user feedback sessions conducted by me, the product manager, and the product owner. We strategically grouped the users into different sessions based on the type of clients they managed. We wanted to ensure we understood the differences in how the analysts may interact with this tool based on their roles and responsibilities.
A few key questions we aimed to answer:
How are users currently interacting with the SQM tool?
Are they using the tool as originally intended?
Are there specific features that are never used, and why are they never used?
What additional features would make this tool more impactful?
What are the pain points with using SQM?
Is this feature used to perform a specific task, or is it mainly used for general research?
What are the steps taken before and after using the SQM tool?
At what point of the customer management process is this feature utilized?
Our findings - scaling back and focusing on most used features.
From our user feedback sessions we found that many of the existing features were not being used, most being the automated elements of the tool. Because language and intent is so critical in evaluating search queries, users did not trust that the automated features would make the correct evaluations like a human would. It was ultimately safer, faster, and produced better results to use the tool manually. This allowed us to cut back on many features and focus on improving the most valuable.
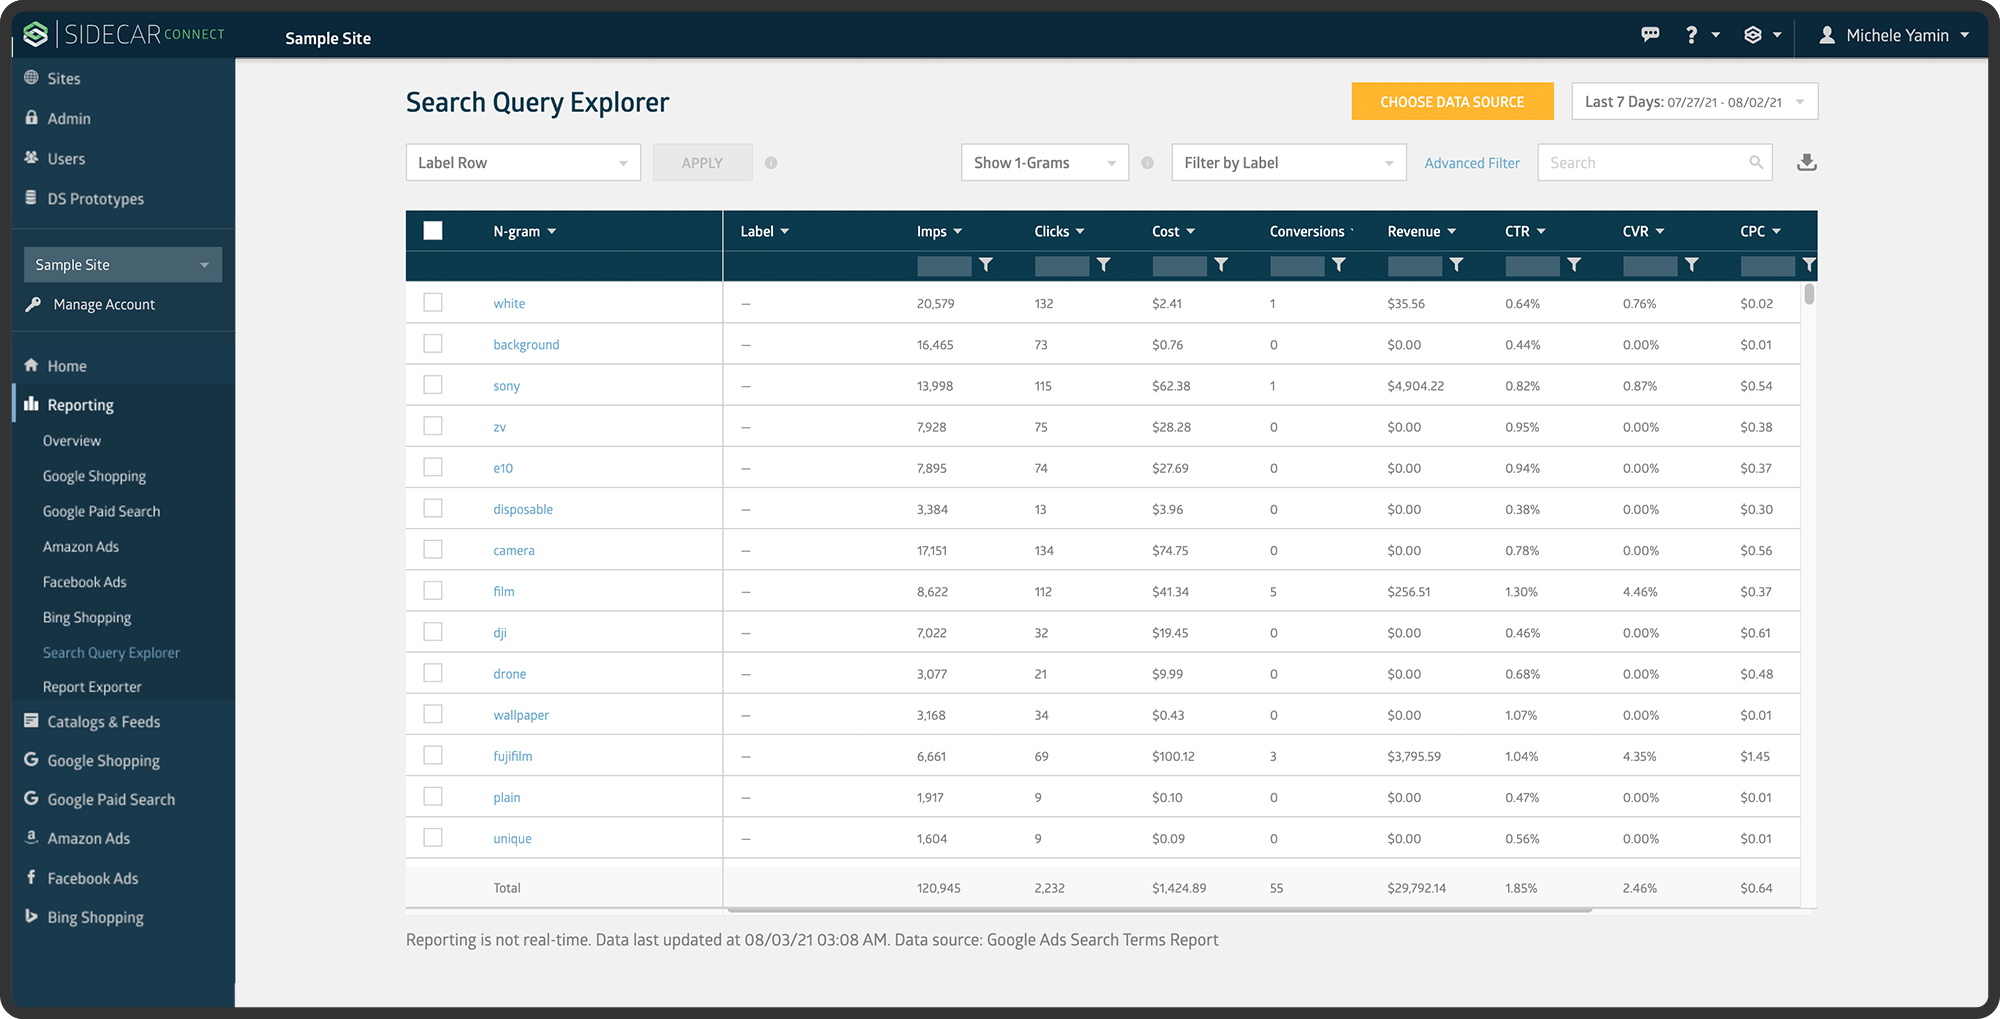
The features we focused on improving for the MVP of the new tool included:
Import data workflow – Create an easier way to import data into the tool. Improve the functionality by adding a campaign filter selection to allow for more specific data imports
Custom date range picker – Allow users to input specific date ranges or choose from commonly used ranges such as last 14 days, last 30 days, last month etc.
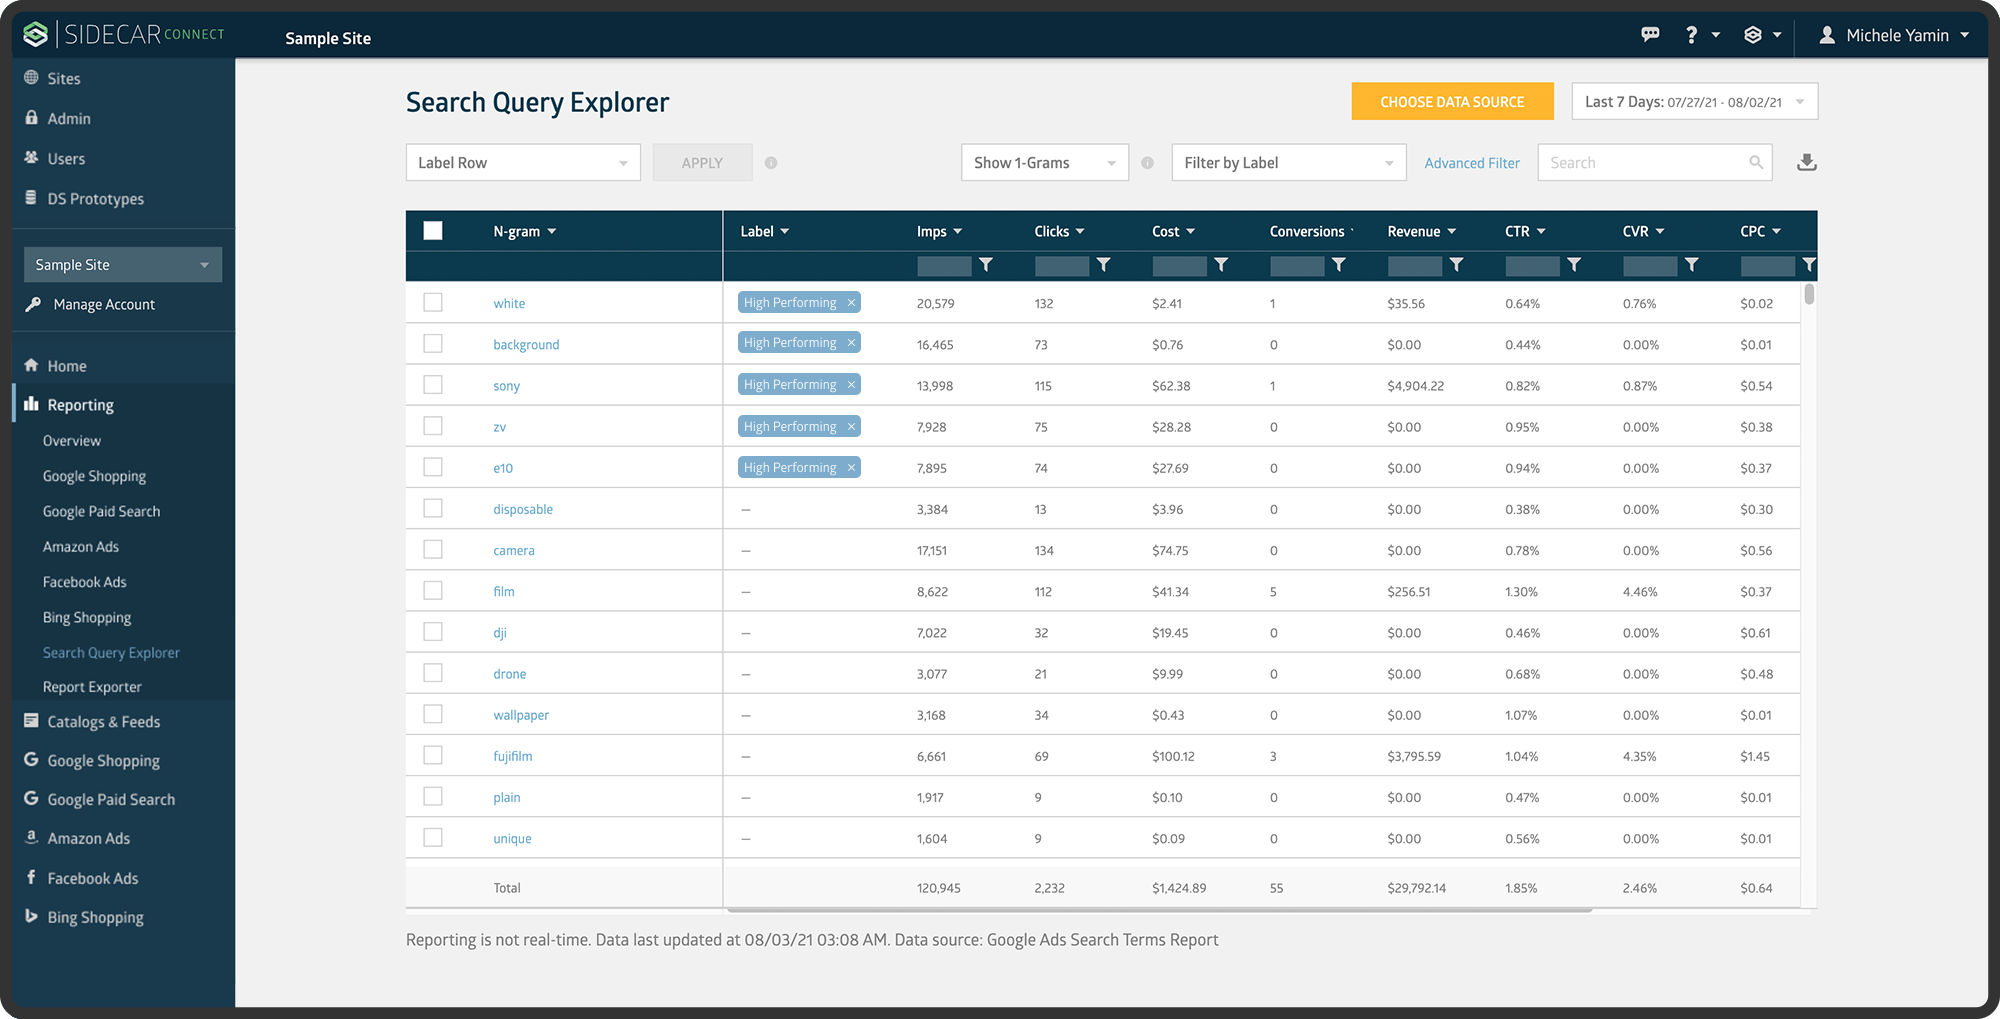
Labeling functionality – Maintain the ability to manually label queries within in the table, remove labels that were not being used
Metric filtering – Maintain the ability to filter metrics within the table
Advanced filtering – Add the ability to exclude terms from the data
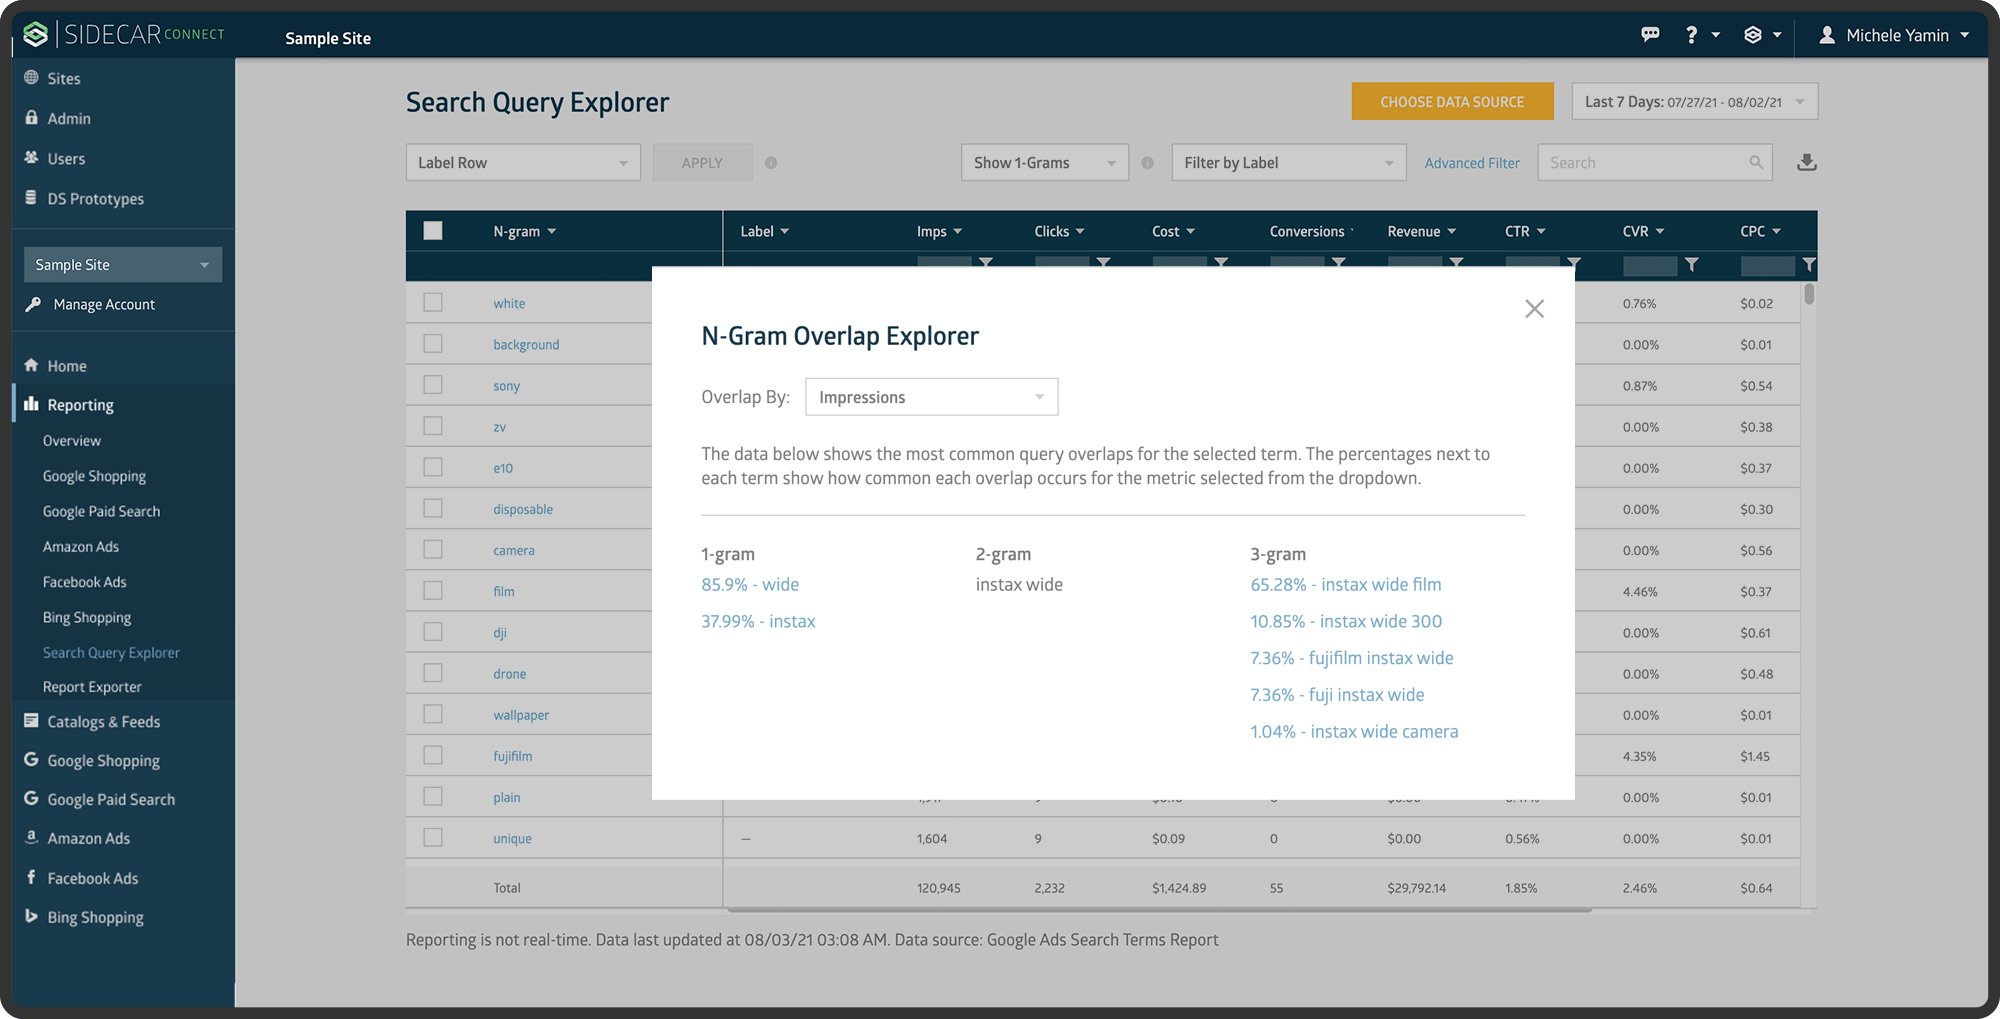
Overlap explorer feature – Improve the experience of the overlap feature by adding more context on how it’s used
Data information – Add data source and time stamp. Add functionality to indicate if any data is missing within the given time range
The Approach
Build in strategic stages to get focused feedback
Because we were building this tool for our internal users, we had the luxury of receiving constant in person feedback. We put together an internal feedback team that consisted of 6 power users of the original SQM tool. The meetings were run by me and the product owner, and the rest of the scrum team joined for visibility, and to ask any additional questions to the end users.
We strategically built the tool in stages that would allow us to test one or two features at a time with our feedback group. For example, we began with building the import data workflow and the populated table with no additional functionality. This allowed the users to focus solely on the import workflow and provide any feedback they may have. Once we made any changes from the feedback sessions, we moved on to adding the more complex features such as the metric filtering and query labeling.
This general process worked well for this type of project, and we were able to identify areas of improvement and small bugs along the way. It also allowed the engineers to participate in the process and get a better understanding of our users.
The result
An improved tool for Sidecar analysts
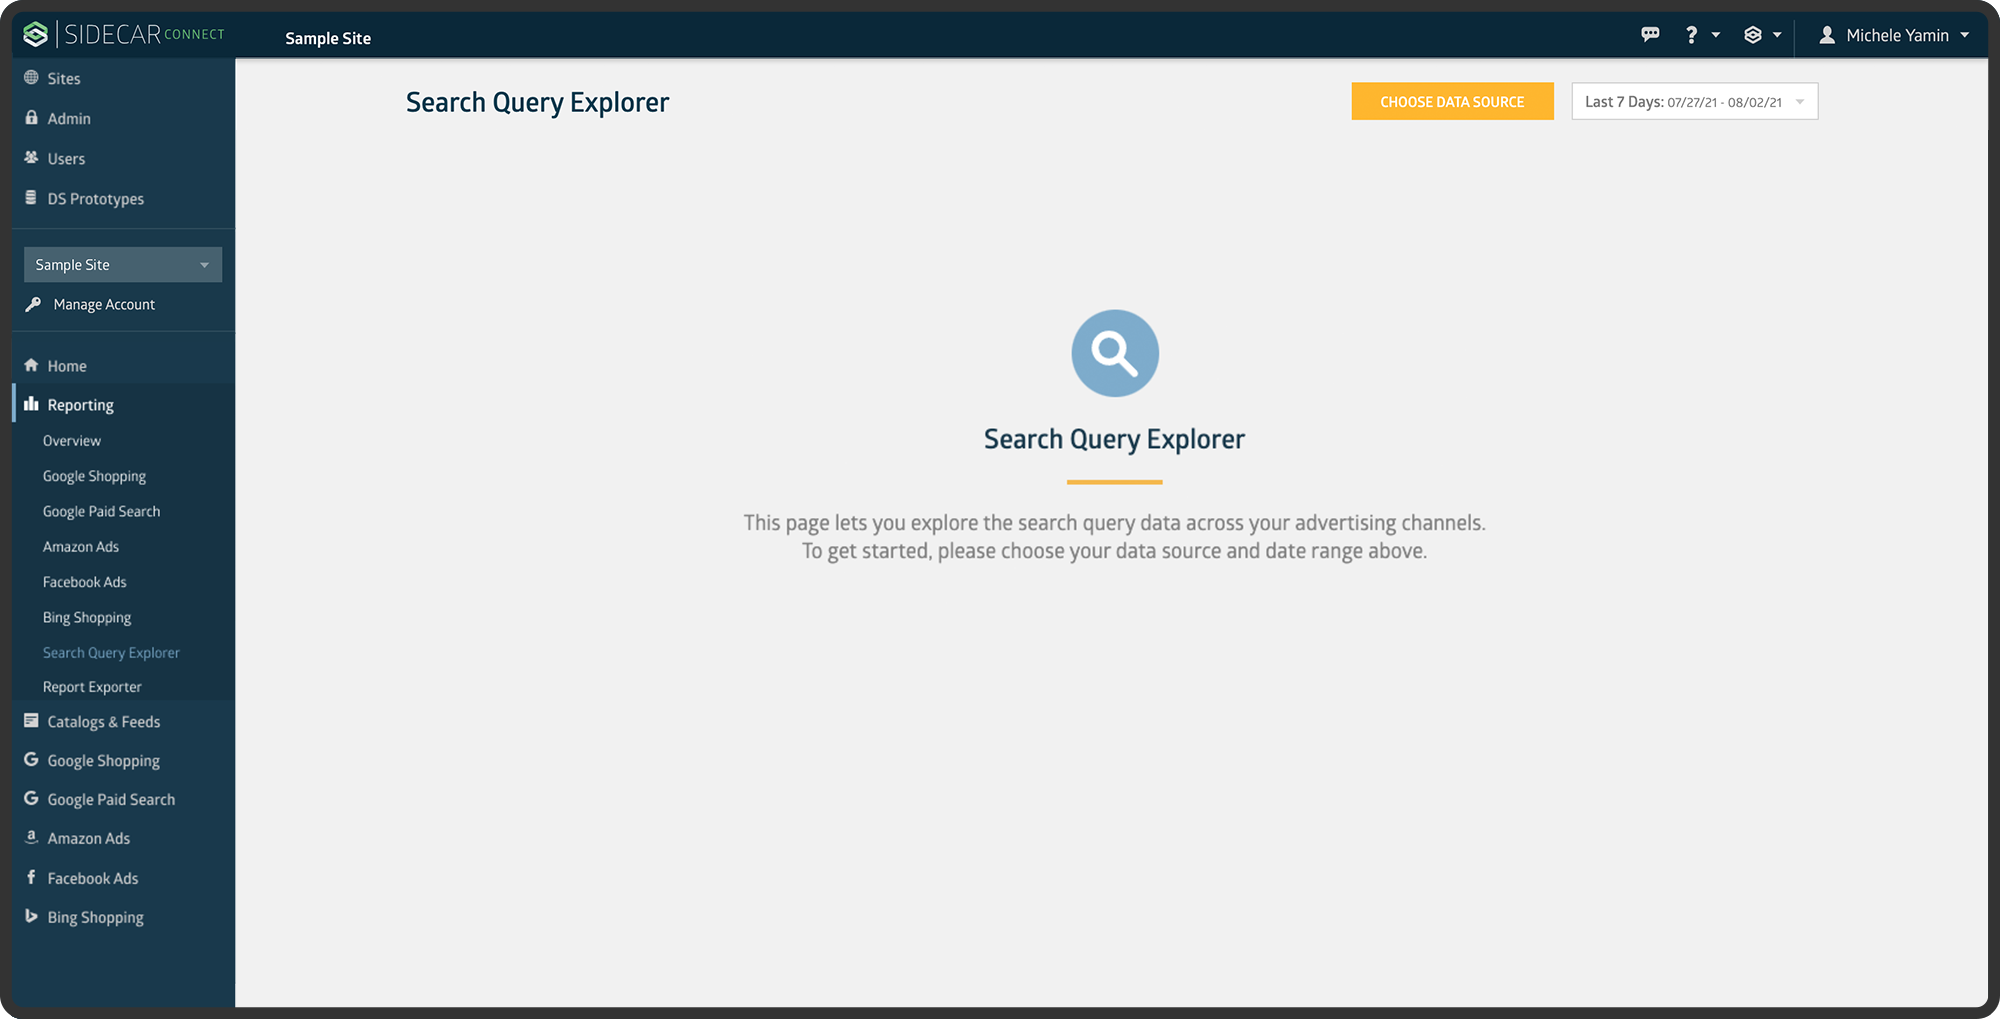
Only July 13th, 2021 Search Query Explorer was released to all internal users within Connect. The overall feedback was very positive, and we were able to sunset the original standalone tool. Search Query Explorer has an average of 13 users per week, which is slightly above the original tool’s usage of 12 users per week. It was used for approximately 60 accounts in the first month of release.